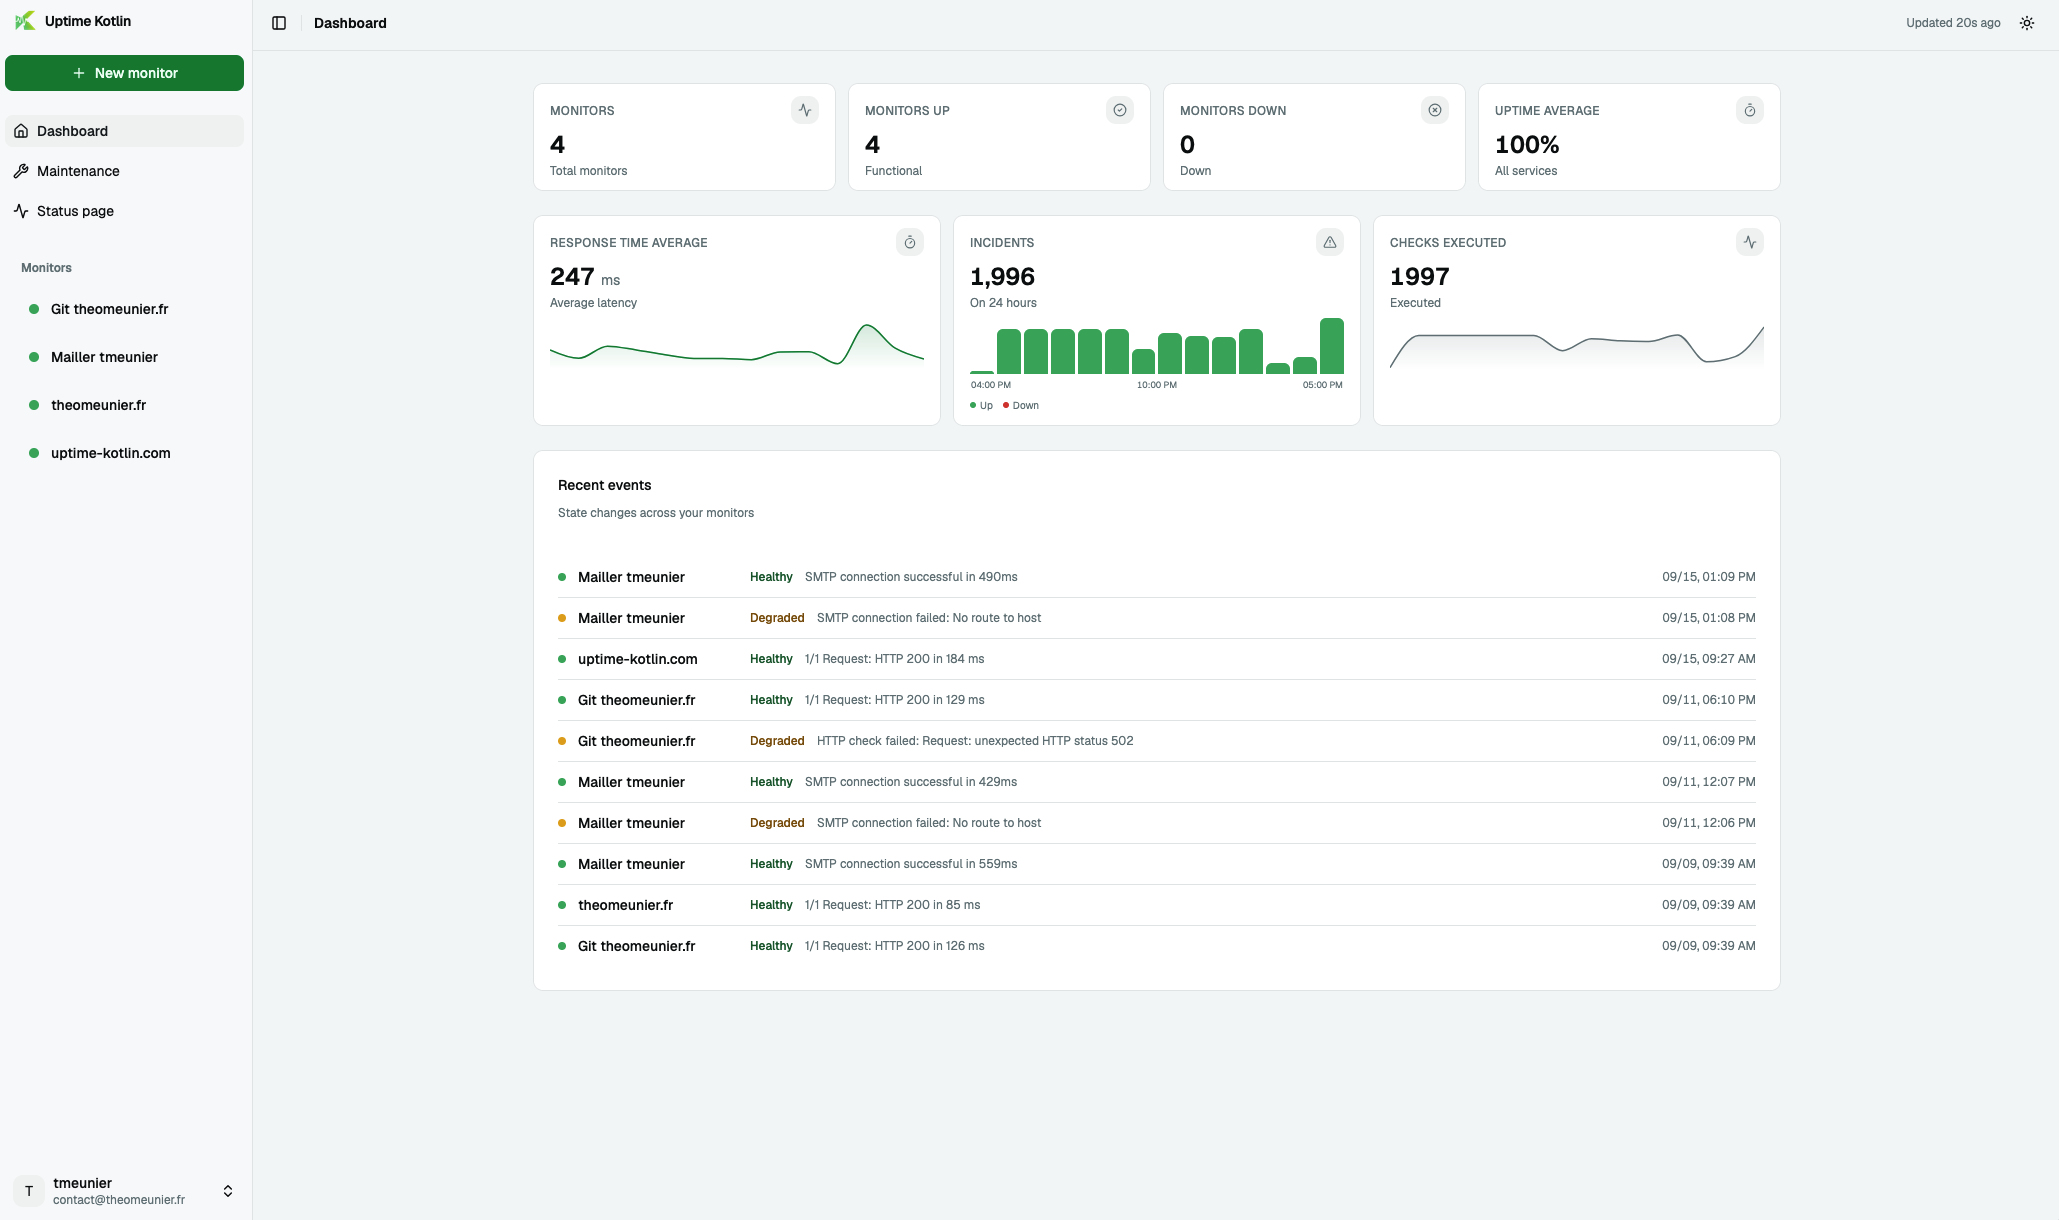
Monitor
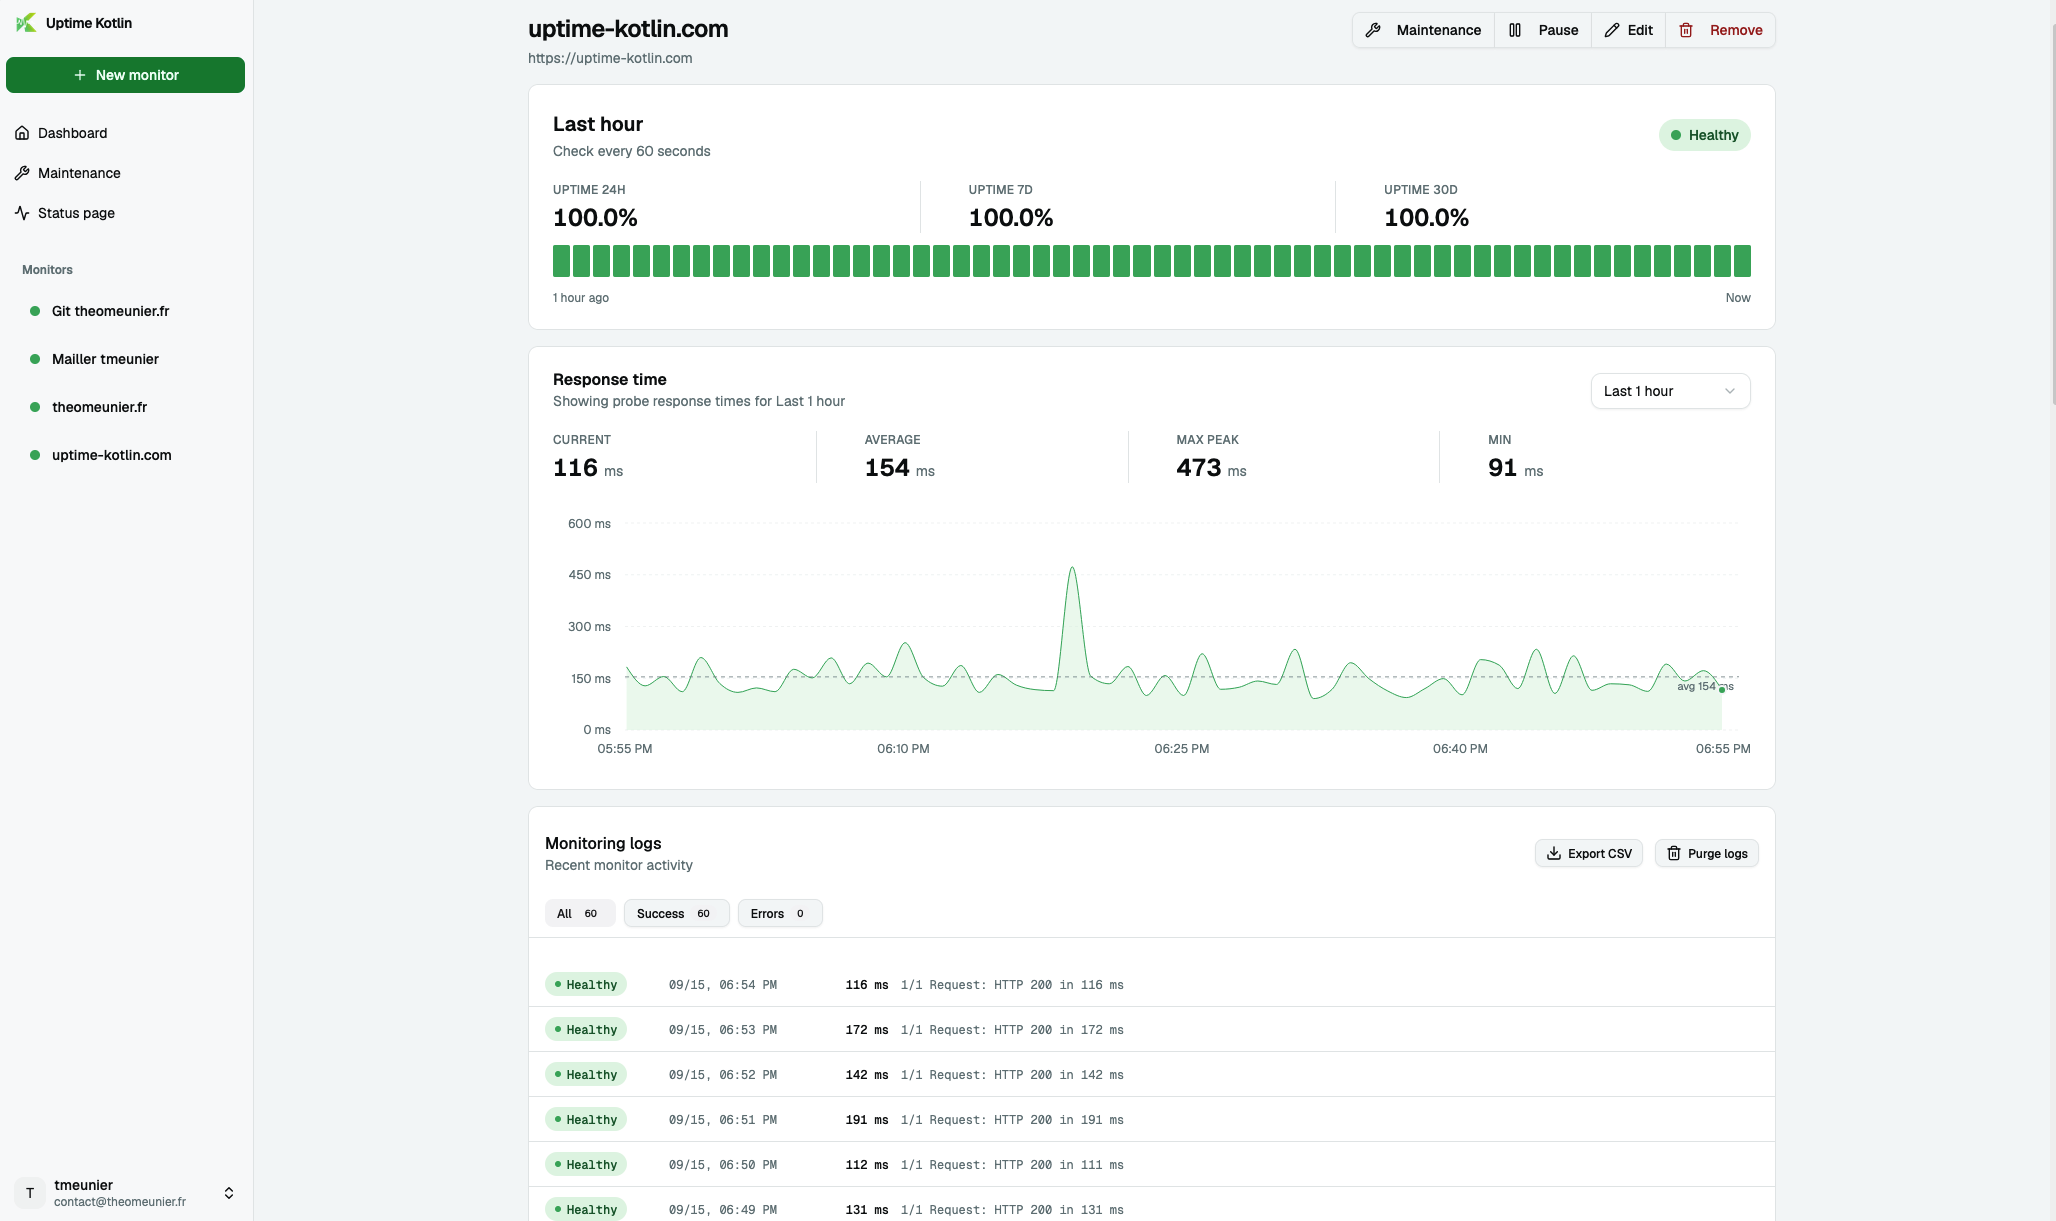
LiveYour entire stack, at a glance.
See health, latency and open incidents for every service the moment something changes.
Uptime Kotlin is a free, open-source uptime monitoring platform that you host yourself. It checks your HTTP, TCP, DNS, ping, database and message-queue endpoints at the interval you choose, alerts your team the moment one fails, and publishes a public status page — on your own infrastructure, with no vendor and no monthly per-monitor fee.
Actual product · synced every 60 seconds
One connected workflow
Create your monitors, understand your infrastructure at a glance, then share only what your users need to know — one continuous workflow, three steps.
Monitor
LiveSee health, latency and open incidents for every service the moment something changes.
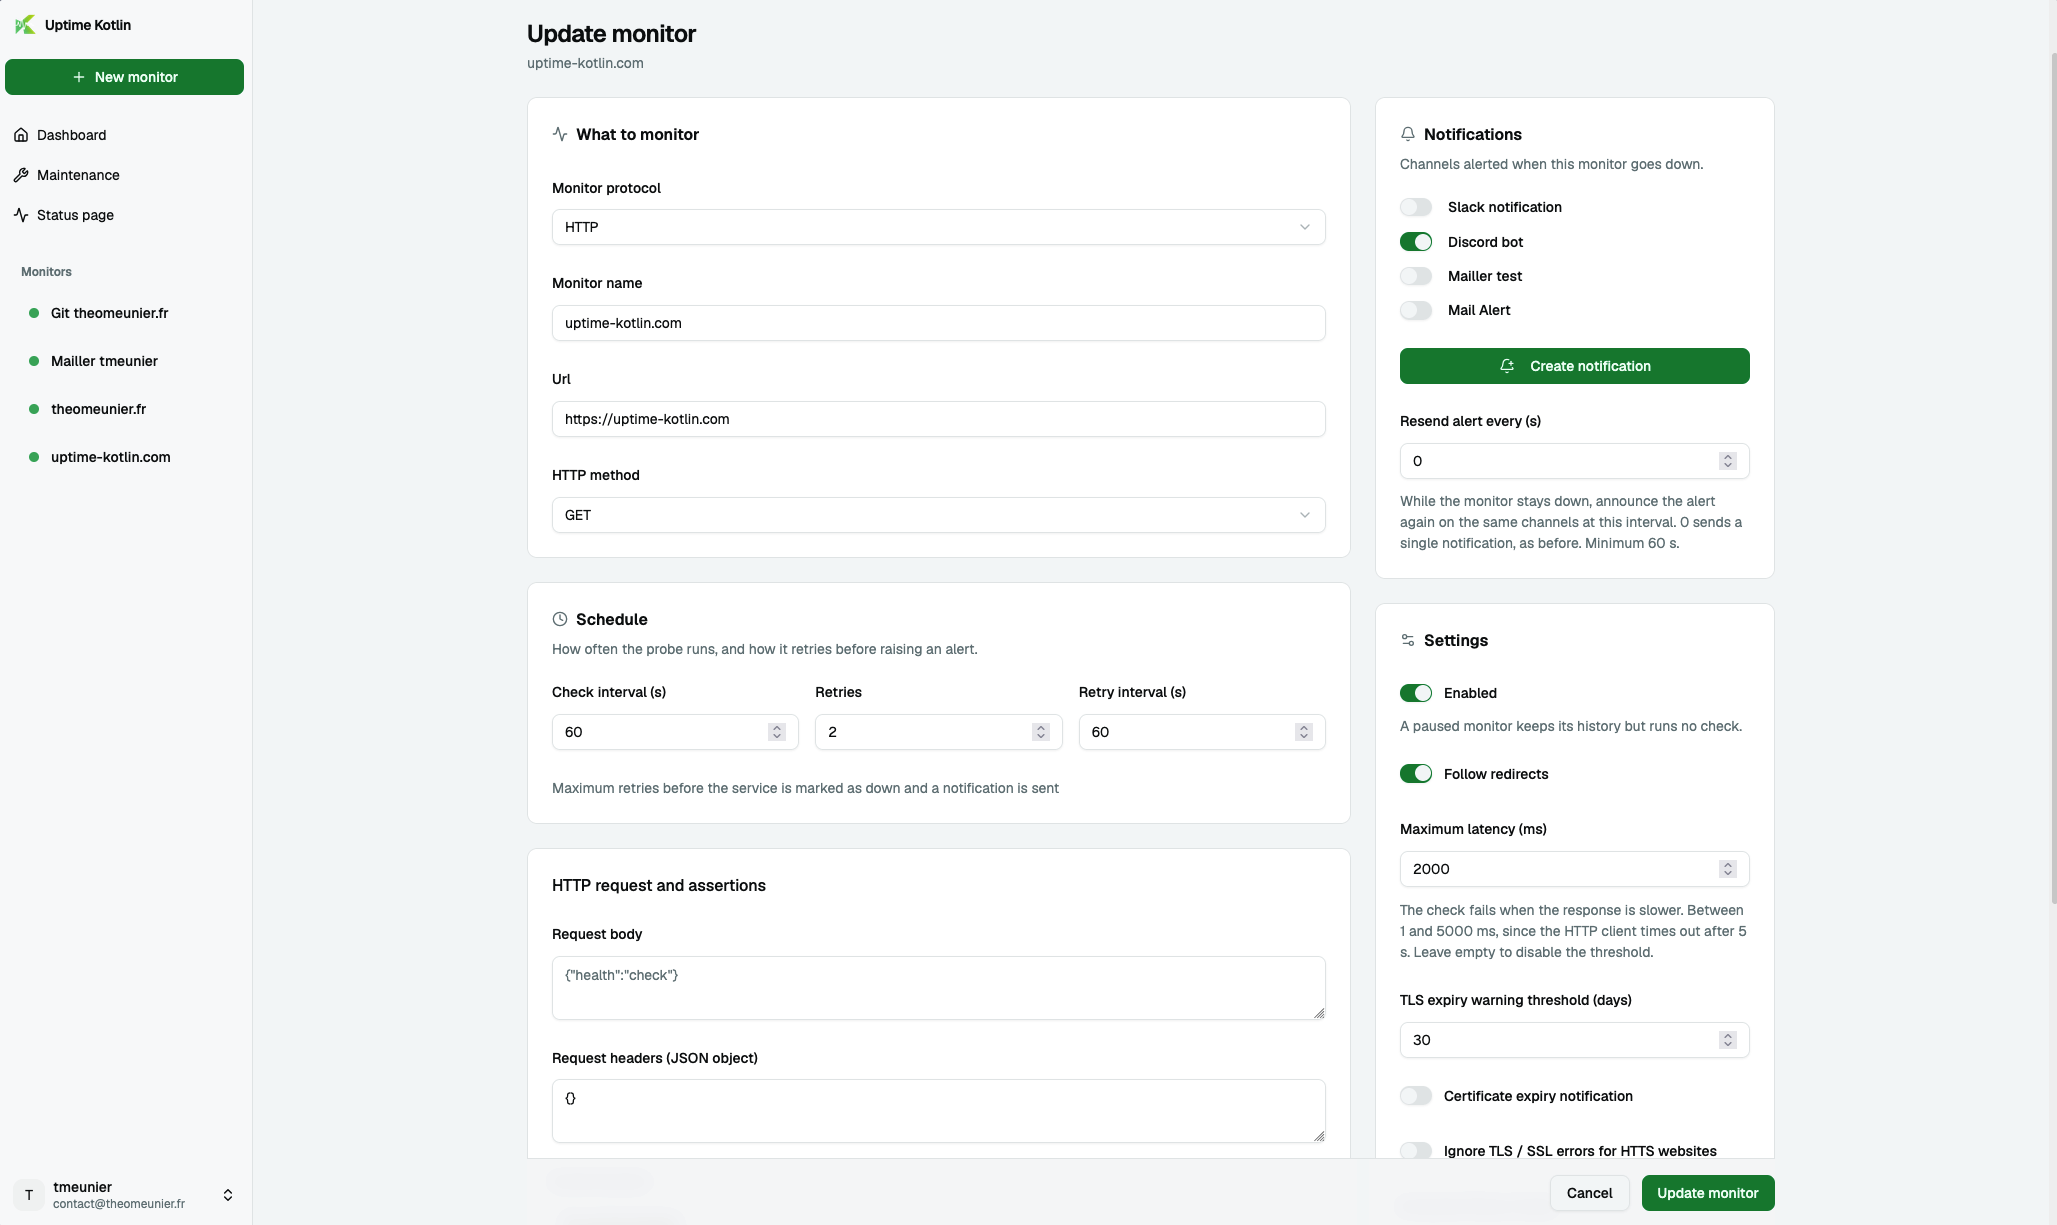
Configure
ReadyPick a protocol, set a target and an interval, wire up alerts — no YAML, no redeploy.
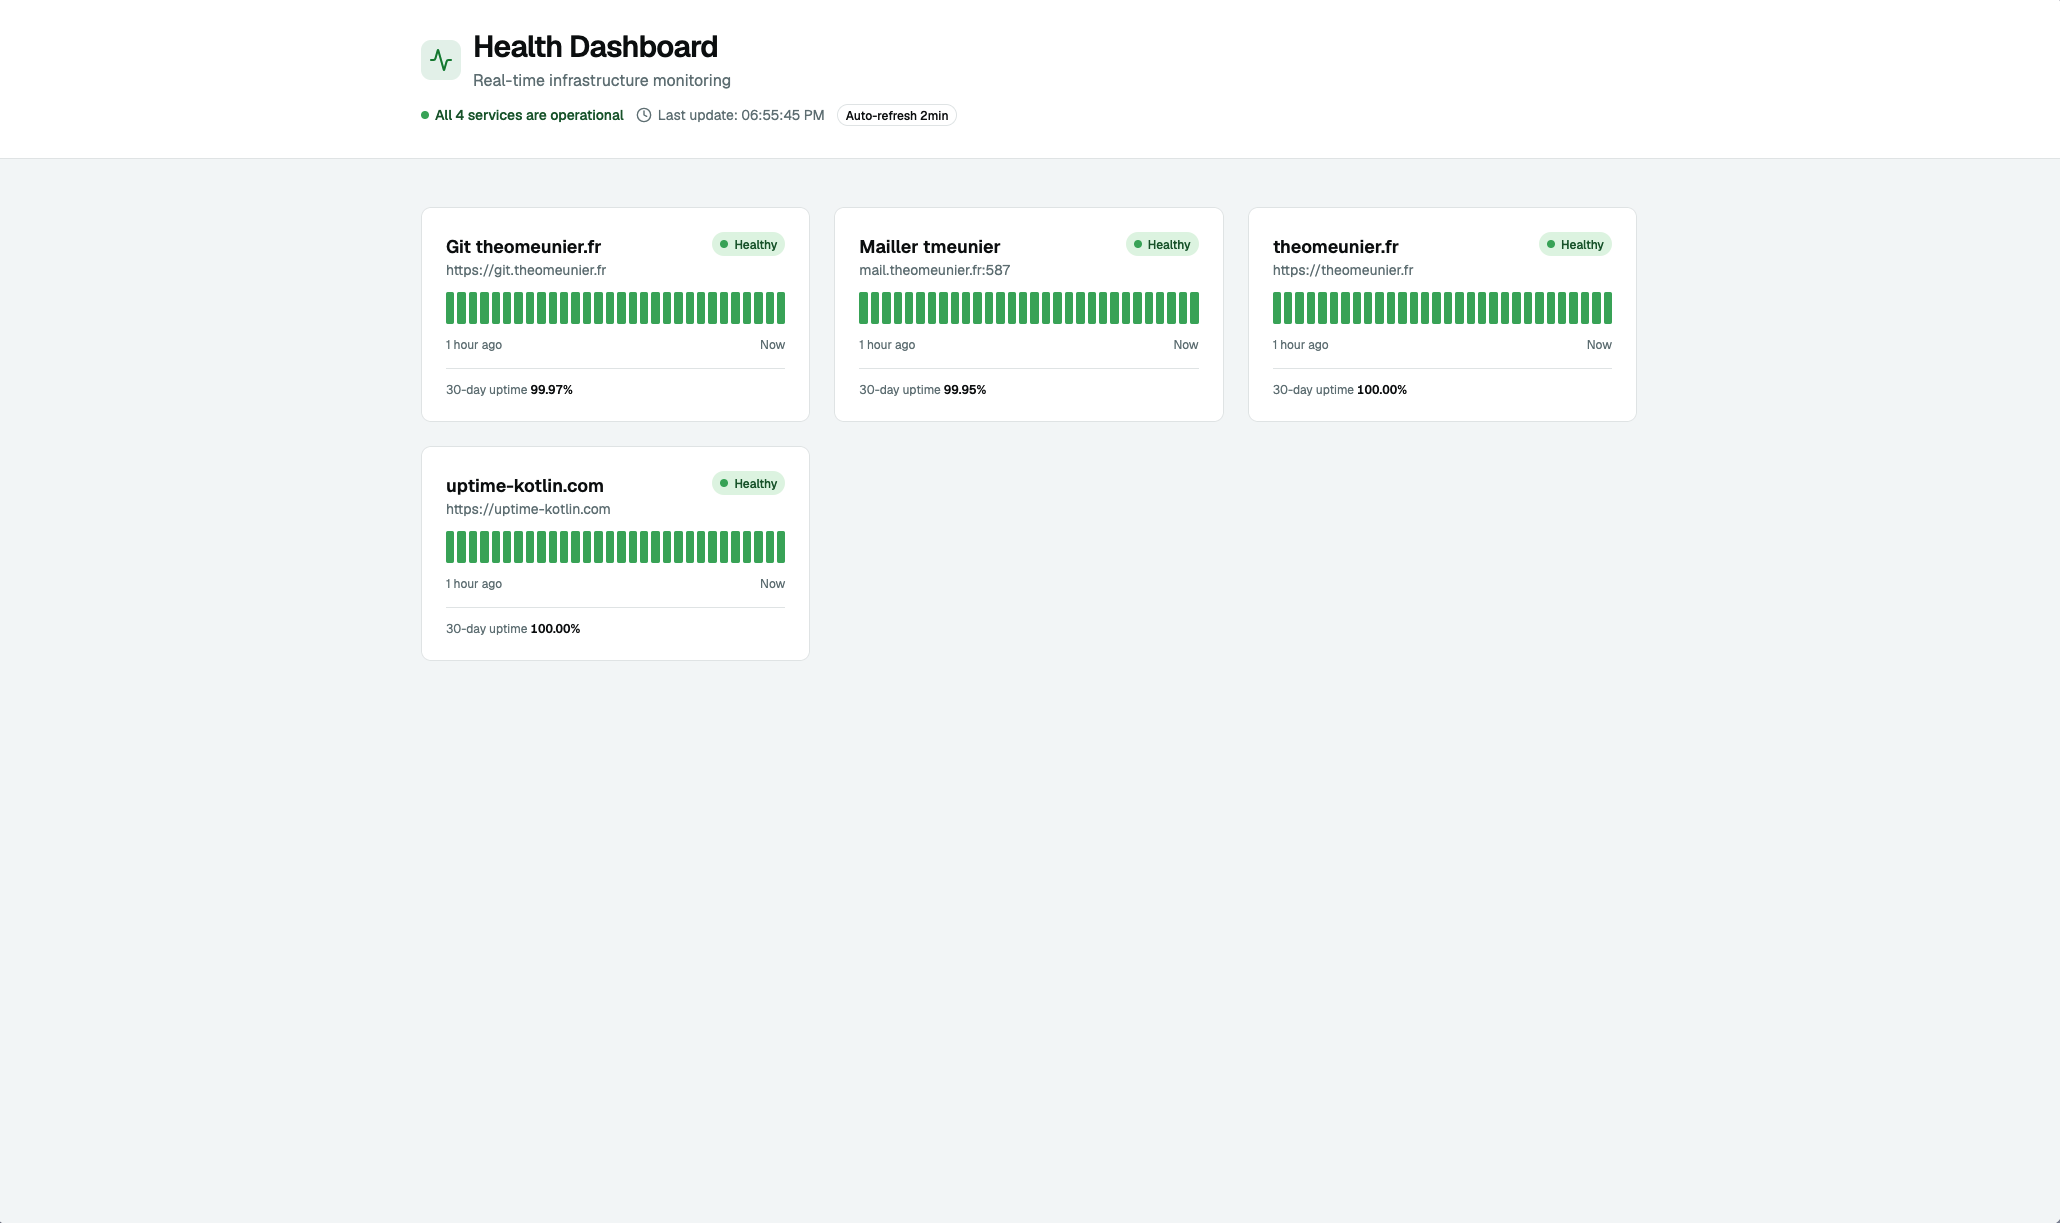
Publish
OnlineA status page your users can check and subscribe to, kept in sync automatically.
Built for the on-call reality
Fast feedback, useful alerts and a dashboard that tells you what matters in one glance. Nothing more. Nothing hidden.
Monitor PING, TCP, DNS, HTTP and more with instant live status updates.
Get notified through Email, Slack, Discord, Teams, webhooks and more.
Track latency, response times, uptime and historical trends across every protocol.
Engineered in Kotlin from the ground up for predictable production stability.
Connect a simple REST API, webhooks and integrations to your existing workflows.
Deploy with Docker, own your data and scale without vendor lock-in.
From zero to watching
Clone the repo, run one Docker command — Uptime Kotlin is watching your services in under a minute.
Clone the repo — the Docker Compose manifest is already set up for you.
Run docker compose up -d to start every service.
Add your first HTTP, TCP, DNS or PING check from the dashboard.
Full setup, configuration and deployment options in the README.
View on GitHubQuestions & answers
Anything missing? Open an issue on GitHub — questions asked there usually end up on this list.
Ask a questionUptime Kotlin is a free, open-source uptime monitoring platform that you host yourself. It checks HTTP, TCP, DNS, ping, database and message-broker endpoints at the interval you choose, alerts your team through Email, Slack, Discord, Microsoft Teams or a webhook when a check fails, and publishes a public status page. It is written in Kotlin, released under the MIT license and deployed with Docker Compose.
Uptime Kotlin is free. There is no paid plan, no per-monitor pricing and no hosted edition to subscribe to: you download the source, run it on your own infrastructure and monitor as many services as your server can handle. The only cost is the machine you run it on.
Eleven monitor types: HTTP/HTTPS, TCP, DNS, ping (ICMP), PostgreSQL, MySQL/MariaDB, Microsoft SQL Server, Redis, SMTP, Apache Kafka and RabbitMQ. Database and message-broker checks are built in, so the backing services of your application are watched from the same dashboard as your public endpoints.
It is, when you need to monitor more than URLs. Uptime Kuma has a larger notification catalogue (90+ providers) and a lighter SQLite install. Uptime Kotlin monitors PostgreSQL, MySQL, SQL Server, Redis, Kafka and RabbitMQ natively, which Uptime Kuma does not, and is written in Kotlin on top of PostgreSQL. Both are MIT licensed and fully self-hosted.
Generate a JWT key pair with OpenSSL, copy the Docker Compose manifest from the repository, fill in your environment variables (encryption key, PostgreSQL credentials, JWT settings), then run docker compose up -d. The dashboard is available on http://localhost:8888. Full instructions are in the README.
In a PostgreSQL database that runs on your own infrastructure, alongside the application. No monitoring data, credential or check result is sent to a third party, and the MIT license lets you fork, audit or modify the code without asking anyone.